Exploring single-cell RNA-seq data
Author: Marin Truchi
Exploring single-cell RNA-seq data
The emergence of single-cell RNA-seq has rapidly overcome the main limitation of bulk RNA-seq: the need to move from tissue resolution to cellular resolution. It has thus redefined the heterogeneity of biological tissues under physiological conditions, through the precise characterization of the expression profiles of known cell types, and the identification of previously unknown cell types or intermediate cell states in developmental and differentiation processes. scRNA-seq has also demonstrated the need to take cellular heterogeneity into account when studying transcriptomic variations induced by pathologies, stimuli or genetic modifications.
Constantly evolving since the early 2010s, single-cell RNA-seq is now a mature technology in terms of protocols and analysis tools. It has thus established itself as a new standard of resolution for functional genomics, whose massive and ever-growing application concerns most biological systems studied worldwide.
A wealth of open-access data
Its widespread application aims in particular to create “cell atlases”, in which the quantity and histological distribution of sequenced samples enable the identification and precise molecular characterization of all cell populations present in the tissue of interest. A large number of tissues have been mapped in cellular atlases of individual organs, or on the scale of entire organisms in atlases produced by international collaborations, such as the Human Cell Atlas or the Tabula Muris. In addition to these physiological atlases, some have been generated from pathological tissues derived from study models or clinical samples (Cancers, Alzheimer, IPF).
As the aim of these various projects is also to serve as a resource and reference for other studies, in a context of open and reproducible science, their data are (almost) systematically available as open access in public repositories (this is generally a condition required for publication).
The format in which these data are deposited is not totally standardized and varies from one laboratory to another, but generally consists of the raw count matrices for each sample and eventually associated metadata (clinical data, treatment, annotations, etc.). In this case, the secondary analysis of the data must be reproduced, even if in some cases the count matrices submitted correspond to cells that have already been filtered and annotated. Authors sometimes deposit the analysis file corresponding to the figures in the publication. Reads of raw sequencing (.fastq format) are rarer, due to their size and the potential problems of patient anonymization that such data could cause. Given the relative standardization of alignment and counting processes, the absence of these raw sequencing data does not pose any real problems for public data mining, which can start with raw count matrices. Details of how to access these data are given in dedicated sections (“Data availability”), usually at the end of the publication. Very often, this involves an access number to be entered into the [GEO] database (http://www.ipfcellatlas.com/ “Gene Expression Omnibus”), which guarantees a relative standardization of file formats and deposited information, as well as rapid access to their download.
Moreover, it is increasingly required that access to data be accompanied by access to the codes and versions of software/packages that have enabled the analysis and production of figures, notably via the [Github] platform (https://docs.github.com/en/get-started/quickstart/hello-world “Github”). Some groups even provide interactive web applications to facilitate access to their data. While these resources give an overview of the dataset, their use is limited by the type and number of visualization tools they provide.
Find a public dataset
While access to data is generally straightforward, finding a public dataset corresponding to a biological system of interest can prove more complex due to the sheer number of pre-existing and emerging studies, which prevents the formation and maintenance of a unique database cataloguing all available datasets. Indeed, while several databases have been created (PanglaoDB, scRNASeqDB, scNavigator, DRscDB, single cell Expression Atlas, Single Cell Portal), they only bring together a fraction of published datasets, and most of them are no longer kept up to date.
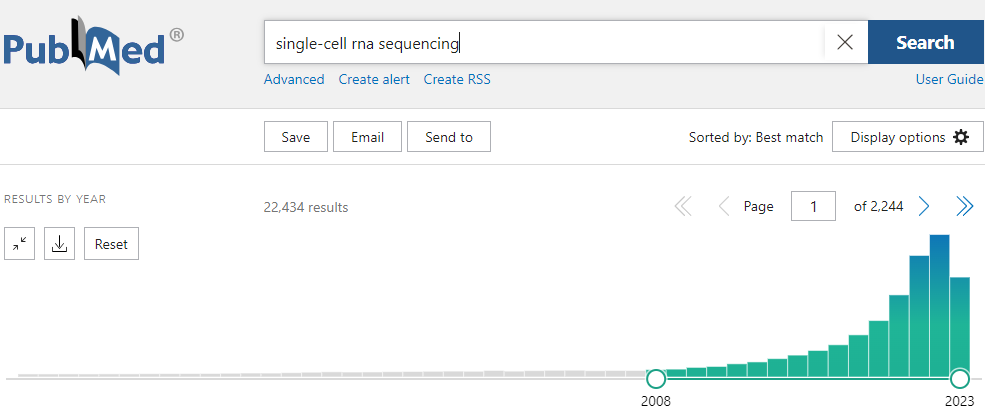
Actually, the best way to find a relevant dataset is to do a keyword search (“organism” + “organ” + “model” + “single-cell RNA-seq”), in pubmed, GEO or directly in google.
Case study: expression of Kcnk12 and Kcnk13 transcripts in dorsal root ganglia in a neuropathic pain mouse model
Nicolas Gilbert, a doctoral student in Florian Lesage’s team, is studying the THIK2 and THIK1 potassium channels, encoded by the KCNK12 and KCNK13 genes, which are notably expressed in dorsal root ganglion (DRG) and whose role is poorly known. Nicolas and his team hypothesize that they may play a role in inflammation and pain. To characterize the expression of these two genes in physiological DRG and in a neuropathic pain model induced by sciatic lesions, we searched for a corresponding public single-cell RNA-seq dataset.
Step 1: searching for a dataset
The following google search: “Dorsal root ganglion neuropathic pain model single-cell RNA-seq” references several publications, including a recent review summarizing the various suitable single-cell RNA-seq datasets, making it much easier to choose which one to explore.

Over 11 publications characterizing cellular heterogeneity in DRG using single-cell RNA-seq are thus listed, each specific in terms of the study model and employed sequencing technology. Among these publications, 4 present complementary characteristics making them particularly interesting to explore :
- Wang, K., Wang, S., Chen, Y., Wu, D., Hu, X., Lu, Y., et al. (2021). Single-cell transcriptomic analysis of somatosensory neurons uncovers temporal development of neuropathic pain. Cell Res.
→ The authors of this study carried out dynamic monitoring of transcriptomic modulations induced by sciatic lesions by single-cell RNA-seq based on droplet isolation. As this model of neuropathic pain (Spared nerve injury or SNI) is used experimentally by Nicolas and his team, this dataset is the most relevant for characterizing Kcnk12 and Kcnk13 expression in DRG under physiological and pathological conditions.
- Jung M, Dourado M, Maksymetz J, Jacobson A, Laufer BI, Baca M, Foreman O, Hackos DH, Riol-Blanco L, Kaminker JS. Cross-species transcriptomic atlas of dorsal root ganglia reveals species-specific programs for sensory function. Nat Commun. 2023
→ This is an atlas that aims to list DRG cell populations in humans and in study models (mouse, guinea pig, macaque), in order to determine conserved or species-specific signatures and homogenize their nomenclature. It is therefore an interesting resource for putting into perspective the signatures found in the dataset of Wang et al. In addition, the authors propose a tool for visualizing gene expression in the various models via a web application.
- Li, C. L., Li, K. C., Wu, D., Chen, Y., Luo, H., Zhao, J. R., et al. (2016). Somatosensory neuron types identified by high-coverage single-cell RNA-sequencing and functional heterogeneity. Cell Res.
→ This older dataset was produced by the same laboratory as Wang et al. but using an alternative single-cell RNA-seq approach that allows only a few hundred cells to be sequenced, but with much greater depth than that obtained via the droplet isolation approach. Data from this type of protocol (“Smart-seq”), although rare, may prove valuable to explore, particularly for observing the expression of transcripts with low abundance or isoform heterogeneity, which could be the case for Kcnk12 and Kcnk13.
- Tavares-Ferreira, D., Shiers, S., Ray, P. R., Wangzhou, A., Jeevakumar, V., Sankaranarayanan, I., et al. (2022). Spatial transcriptomics of dorsal root ganglia identifies molecular signatures of human nociceptors. Sci. Transl. Med.
→ This latest dataset provides spatial transcriptomics data, enabling visualization of the in situ expression of KCNK12 and KCNK13 on human DRG sections. By adding the spatial dimension, these data could complete the exploration of the expression of these two genes.
Step 2 : Download and inspection of data from Wang et al, Cell Res. 2021.
The “Data Availability” section of the publication indicates that the data analyzed in the study are stored in GEO and downloadable via the access number indicated.

Once the access number has been entered, we are redirected to the web page of the data series associated to the study. This web page summarizes the main publication information (title, author, type of experiment, abstract), and provides information on the experimental design. At the bottom of the page, a table lists the files corresponding to the deposited data, with their name, size and format. Normally, the name of these files and the information given on the page should make it easy to match each file to a sample or to a part of the analysis presented in the publication. In this case, however, the nomenclature of the files submitted by the authors is not explicit, except for those corresponding to the Smart-seq data of Li et al. which have been reanalyzed for the purpose.
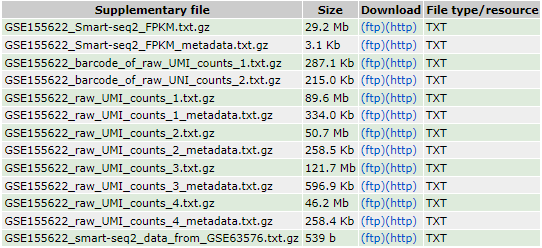
The original study data are divided into 4 datasets, each with a text file corresponding to the raw counts and a text file corresponding to the metadata. The first two datasets are also associated with a “barcodes” file listing the cellular barcodes of the selected droplets. After inspection of the metadata and rereading of the publication, each dataset corresponds to a distinct sequencing experiment, which explains the heterogeneity of the formats and structure of the metadata:
The first dataset corresponds to the first experiment, where DRG samples were sequenced in physiological condition, as well as 6h, 24h, 2 days, 7 days and 14 days after sciatic lesions (35894 cells).
The second dataset corresponds to a second experiment, where further DRG samples were sequenced in physiological condition, as well as 6h or 24h after sciatic lesions (27248 cells).
The third dataset corresponds to a third experiment, repeating the first with the same conditions (35974 cells).
The final dataset corresponds to a fourth experiment, in which the authors resequenced physiological DRG samples and added DRG samples sequenced 28 days after sciatic injury (15127 cells).
The complexity of the overall dataset design, its volume, as well as the heterogeneity of metadata structures and matrix dimensions of its sub-datasets, indicated that it was more relevant to restrict the analysis to the first dataset at this stage.
Step 3 : Re-analysis of the first dataset
1. Loading data into Rstudio and creating an analysis “object”
Analysis of single-cell RNA-seq data from count matrices is carried out in a software environment that enables tool libraries to be loaded, scripts to be edited and compiled, variables to be visualized and data to be represented graphically, all in the same programming language. For the R language, analysis of single-cell RNA-seq data is carried out in the Rstudio development environment (IDE), and is based in particular on the seurat package.
In these environments, single-cell RNA-seq data are structured in a format that stores both raw and transformed [genes x cells] count matrices, as well as gene (Ensembl ID, Symbol) and cell (total count, original sample, annotated cell type etc.) metadata, ordered according to their position in the count matrix. As the analysis progresses, further information will be stored in this “object”, including the results of dimension reductions.
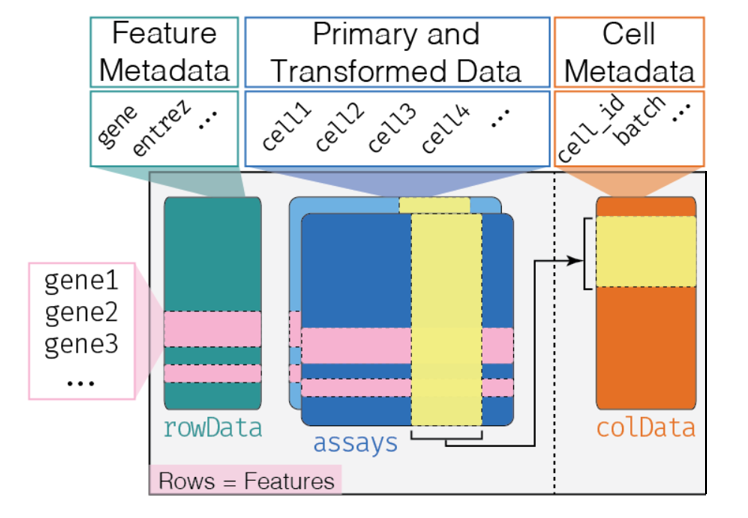
From Orchestrating Single-Cell Analysis with Bioconductor
Once imported, the text files corresponding to the first dataset’s count matrix and associated metadata are formatted into a seurat object called “WangDRG”. This object contains the expression matrix of 23904 genes in 35894 cells, as well as the table of metadata saved by the authors. The metadata table is divided into 8 variables, which provide in particular for each of the 35894 cells its identifier (barcode), its condition, and the annotated cell type.

2. Transform the data and reduce its dimensionality for visualization.
As it stands, the data are not yet usable for visualizing the expression of our genes of interest. Indeed, the raw counts do not take into account possible variations in sequencing depth between different samples, or other sources of technical variability, which may bias both the quantification of gene expression and the projection of the data in reduced dimensions. To overcome this, the data must be normalized and then integrated, before performing PCA and then 2-dimensional projection (see the article on data analysis). Once these steps have been completed, data exploration and visualization can begin.
3. Visualize the dataset and Kcnk12/Kcnk13 expression.
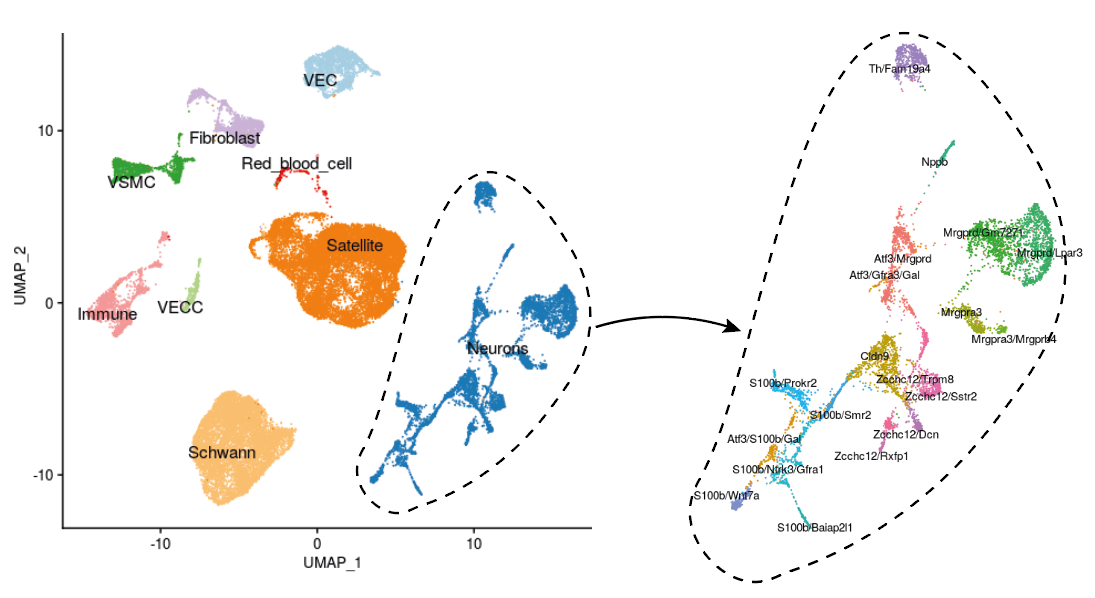
The first representation of the dataset we can propose is the projection of the data in 2 dimensions via a UMAP algorithm, all conditions gathered.
DRG cells are grouped according to their expression profile into 9 main populations: neurons, glial satellite cells, Schwann cells, vascular endothelial cells (VEC), vascular capillary endothelial cells (VECC), vascular smooth muscle cells (VSMC), fibroblasts, immune cells and red blood cells (RBC). Some populations are particularly heterogeneous in terms of transcriptomic signature, notably neurons. Indeed, the authors of Wang et al. propose a classification of 20 neuronal populations based on the expression of certain markers.
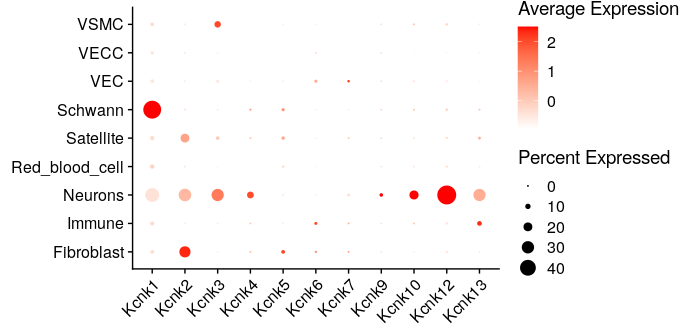
In a “DotPlot” representation of the normalized mean expression of genes coding for K2P-type potassium channels detected in the dataset, we can see that Kcnk12 is the most highly expressed in DRG neurons. This representation also shows the percentage of transcript expression in each population, i.e. the proportion of cells in which at least 1 mRNA molecule is detected relative to the total population. Kcnk12 is highly specific, being expressed in around 50% of neurons, compared with less than 2% in other populations. As for Kcnk13, its expression is weaker than Kcnk12 in neurons, and a slight signal is detected in immune cells.
It should be noted that here the expression values are centered and reduced (z-score calculation where the mean is subtracted and divided by the standard deviation), which makes it possible to represent the expression of each gene at its own scale, and thus avoid the most highly expressed genes “crushing” the signal.
In this representation of Kcnk12 and Kcnk13 expression in reduced-dimensional space (“FeaturePlot”), we observe that these two genes are expressed in only a portion of neuronal populations.
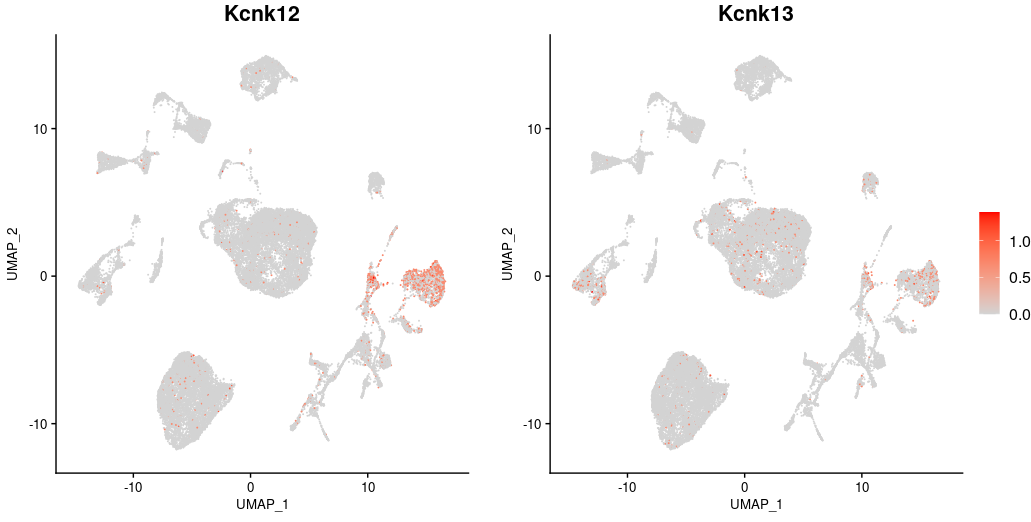
In order to document their expression more precisely in these populations and under the different conditions, the next steps consisted in integrating all the neurons sequenced by the authors in the various datasets, and then comparing the populations identified with those annotated in the cellular atlas constructed by Jung et al., (Nat Commun. 2023).
Step 4: Integration of all 4 datasets and neuron annotation
After importing the count matrices of the 4 datasets, homogenizing the metadata and the quantified genes, and selecting the cells corresponding to neurons, we obtain a dataset of 27198 cells. Once the data from the different samples have been normalized and integrated, the aim is to annotate the clusters corresponding to the different neuronal populations, in order to give biological meaning to the description of Kcnk12/Kcnk13 expression.
On the basis of expression profiles in the reduced-dimensional space obtained by PCA, about twenty isolated communities are distinguished in an unsupervised manner (the number of clusters is not predefined). If we project Wang et al.’s original annotations onto these communities, we see that each unannotated cluster corresponds roughly to a population defined by these authors. However, these annotations are only made on the basis of specific gene expression, which gives no information on the function of the associated populations.
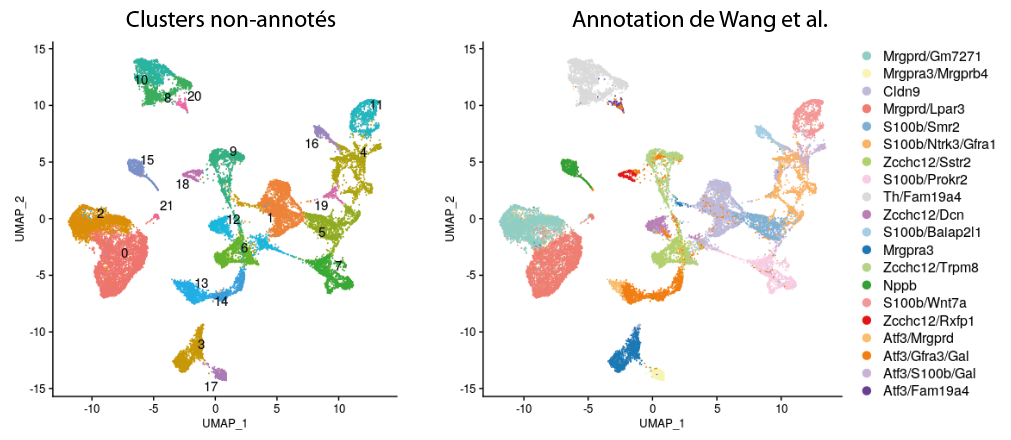
An alternative approach is the annotation proposed by Jung et al. which seeks to establish consensus transcriptomic signatures across multiple species. The authors thus identified 5 major classes of neurons conserved in DRGs:
- A-LTMRs (A-fiber low-threshold mechanoreceptors)
- C-LTMRs (C-fiber low-threshold mechanoreceptors)
- NPs (non-peptidergic nociceptors)
- PEPs (peptidergic nociceptors)
- Cold thermoreceptors
These 5 major classes are further divided into several subtypes, characterized by the expression of specific markers, for a total of 11 mammalian-conserved populations.

Based on the expression of these markers in the integrated dataset of Wang et al., we find all these 11 populations, to which are added 4 specific clusters from the dataset of Wang et al. Among these additional clusters are a population marked by the specific expression of Rfxp1 as well as three populations expressing neuronal markers C-LTMRs, NPs and PEPs, but overexpressing Atf3 and corresponding to specific cellular states of DRG from mice with sciatic lesions.

Indeed, if we follow the evolution of the relative proportions of the different sub-populations in control condition and following the response to sciatic lesions, we observe an appearance of the “NP Atf3”, “PEP Atf3” and “C-LTMR Atf3” sub-populations from 24h post-lesions. These populations represent around 25% of the cells sequenced between the second and the seventh post-injury day, then tend to disappear in the following weeks. Comparing the relative proportions of each subpopulation, “NP Atf3” and “C-LTMR Atf3” reached a peak around day 2, while “PEP Atf3” peaked at 7 days post-injury. At 14 days, while the proportions of “NP Atf3” and “C-LTMR Atf3” have fallen drastically, that of “PEP Atf3” remains high. At 28 days, only a small proportion of “PEP Atf3” remains. At transcriptomic level, these 3 cell states share a signature marked in particular by the expression of Atf3, Sprr1a, Sox11, Gap43, Nts, Gadd45a, Gal or Cdkn1a, as shown in the heatmap. This signature is described in the literature as that of “regeneration-associated genes” (RAGs), essential for the regeneration of damaged axons.

Step 5: Visualization of Kcnk12 and Kcnk13 expression
Once the different neuronal populations have been annotated, Kcnk12 / Kcnk13 expression can finally be visualized. One of the most appropriate graphical representations for single-cell RNA-seq data is called ViolinPlot. This representation shows the expression of a single gene in each cell of the dataset, while grouping cells according to their annotation (or sample/condition). The expression level is represented as a dot (one for each cell), to which is added a density curve indicating the distribution of counts and possibly a boxplot summarizing the median, 1st and 3rd quartile.
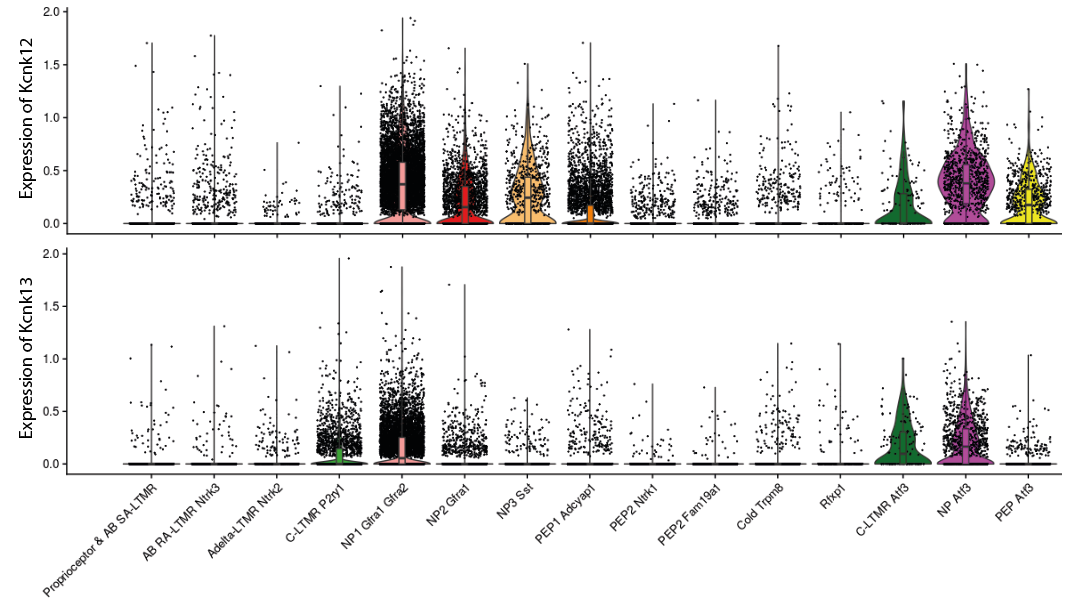
For Kcnk12, its transcript is expressed under physiological conditions in the NP1, NP2 and NP3 subpopulations of non-peptidergic nociceptor neurons, as well as in the PEP1 subpopulation of peptidergic nociceptor neurons to a lesser extent. It was also found expressed in the 3 subpopulations detected in DRG samples from mice with sciatic lesions: “NP Atf3”, “PEP Atf3” and “C-LTMR Atf3”. Kcnk13 expression is generally lower in physiological conditions and appears to be restricted to the NP1 and C-LTMR populations. However, it appears to be slightly over-expressed in equivalent neuropathic pain-specific populations, i.e. “NP Atf3” and “C-LTMR Atf3”.
These expression profiles suggest overexpression of Kcnk12, and to a lesser extent Kcnk13, in the neuropathic pain model. To test this hypothesis statistically, the pseudobulk differential analysis approach seemed appropriate, given the availability of biological replicates in the integrated dataset.
To perform this differential analysis, cells from the 3 neuropathic pain-specific subpopulations were grouped for each sample with their associated physiological population (NP1/NP2/NP3 for Atf3 NPs, PEP1/PEP2/PEP3 for Atf3 PEPs and C-LTMR for Atf3 C-LTMRs). Their raw counts were then aggregated to form pseudobulks. For each of the 3 subsets of neurons (NPs, PEPs and C-LTMRs) we obtained 4 control samples (1 for each dataset), 3 SNI 6h and 3 SNI 24h samples (datasets 1,2 and 3), 2 SNI 2d, SNI 7d and SNI 14d samples (datasets 1 and 3) and 1 SNI 28d sample. To compare the control samples with a sufficient number of pathological samples, a “peak” SNI condition was created by grouping together the samples for which the highest proportions of populations associated with the RAGs signature were observed, i.e. the SNI 24h, SNI 2d and SNI 7d conditions.
The differential expression between the 4 control samples and the 7 SNI “peak” samples, represented in a boxplot, indicates that Kcnk12 is statistically overexpressed in neuropathic pain condition in PEP neurons. A trend of Kcnk13 overexpression is also observed in this same population.
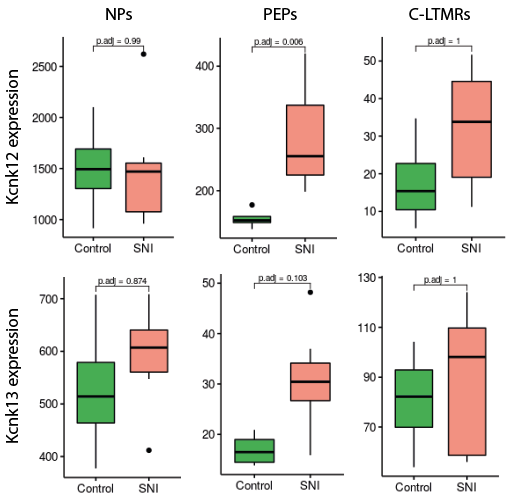
If we look at the results of the differential analyses carried out on each of the 3 neuron subpopulations, we see that other genes encoding K2P-type potassium channels are differentially expressed in the SNI model: Kcnk18 is down-regulated in PEPs and Kcnk16 is over-expressed in all 3 subpopulations.

Visualizing the integrated dataset via a web application
The integrated and analyzed dataset corresponding to all the DRG neurons sequenced by Wang et al. can be viewed via a web application. In this application, gene expression can be visualized as FeaturePlot, ViolinPlot/Boxplot and DotPlot/Heatmap, with the option of grouping cells by population or condition.
