From tissue to single-cell scale
Author: Marin Truchi
Introduction to single-cell RNA-seq
From tissue to single-cell scale
Given its efficiency, precision and sensitivity, RNA-seq is a powerful tool for comparing the expression levels of tens of thousands of transcripts between samples by differential analysis. However, in order to obtain the quantity of RNA required for sequencing (~100 ng), molecules are isolated from whole tissues and tens of thousands of cells. RNA quantification after sequencing is thus an average of expression across the different cell types in the tissue, hence the name “bulk” RNA-seq. However, this cellular heterogeneity biases:
- the detection of differentially expressed genes specific to a restricted fraction of cell populations
- the interpretation of differential analysis, in cases where the transcriptomic modulations measured are due to variations in the proportions of cell types sampled in the tissue from one sample to another.
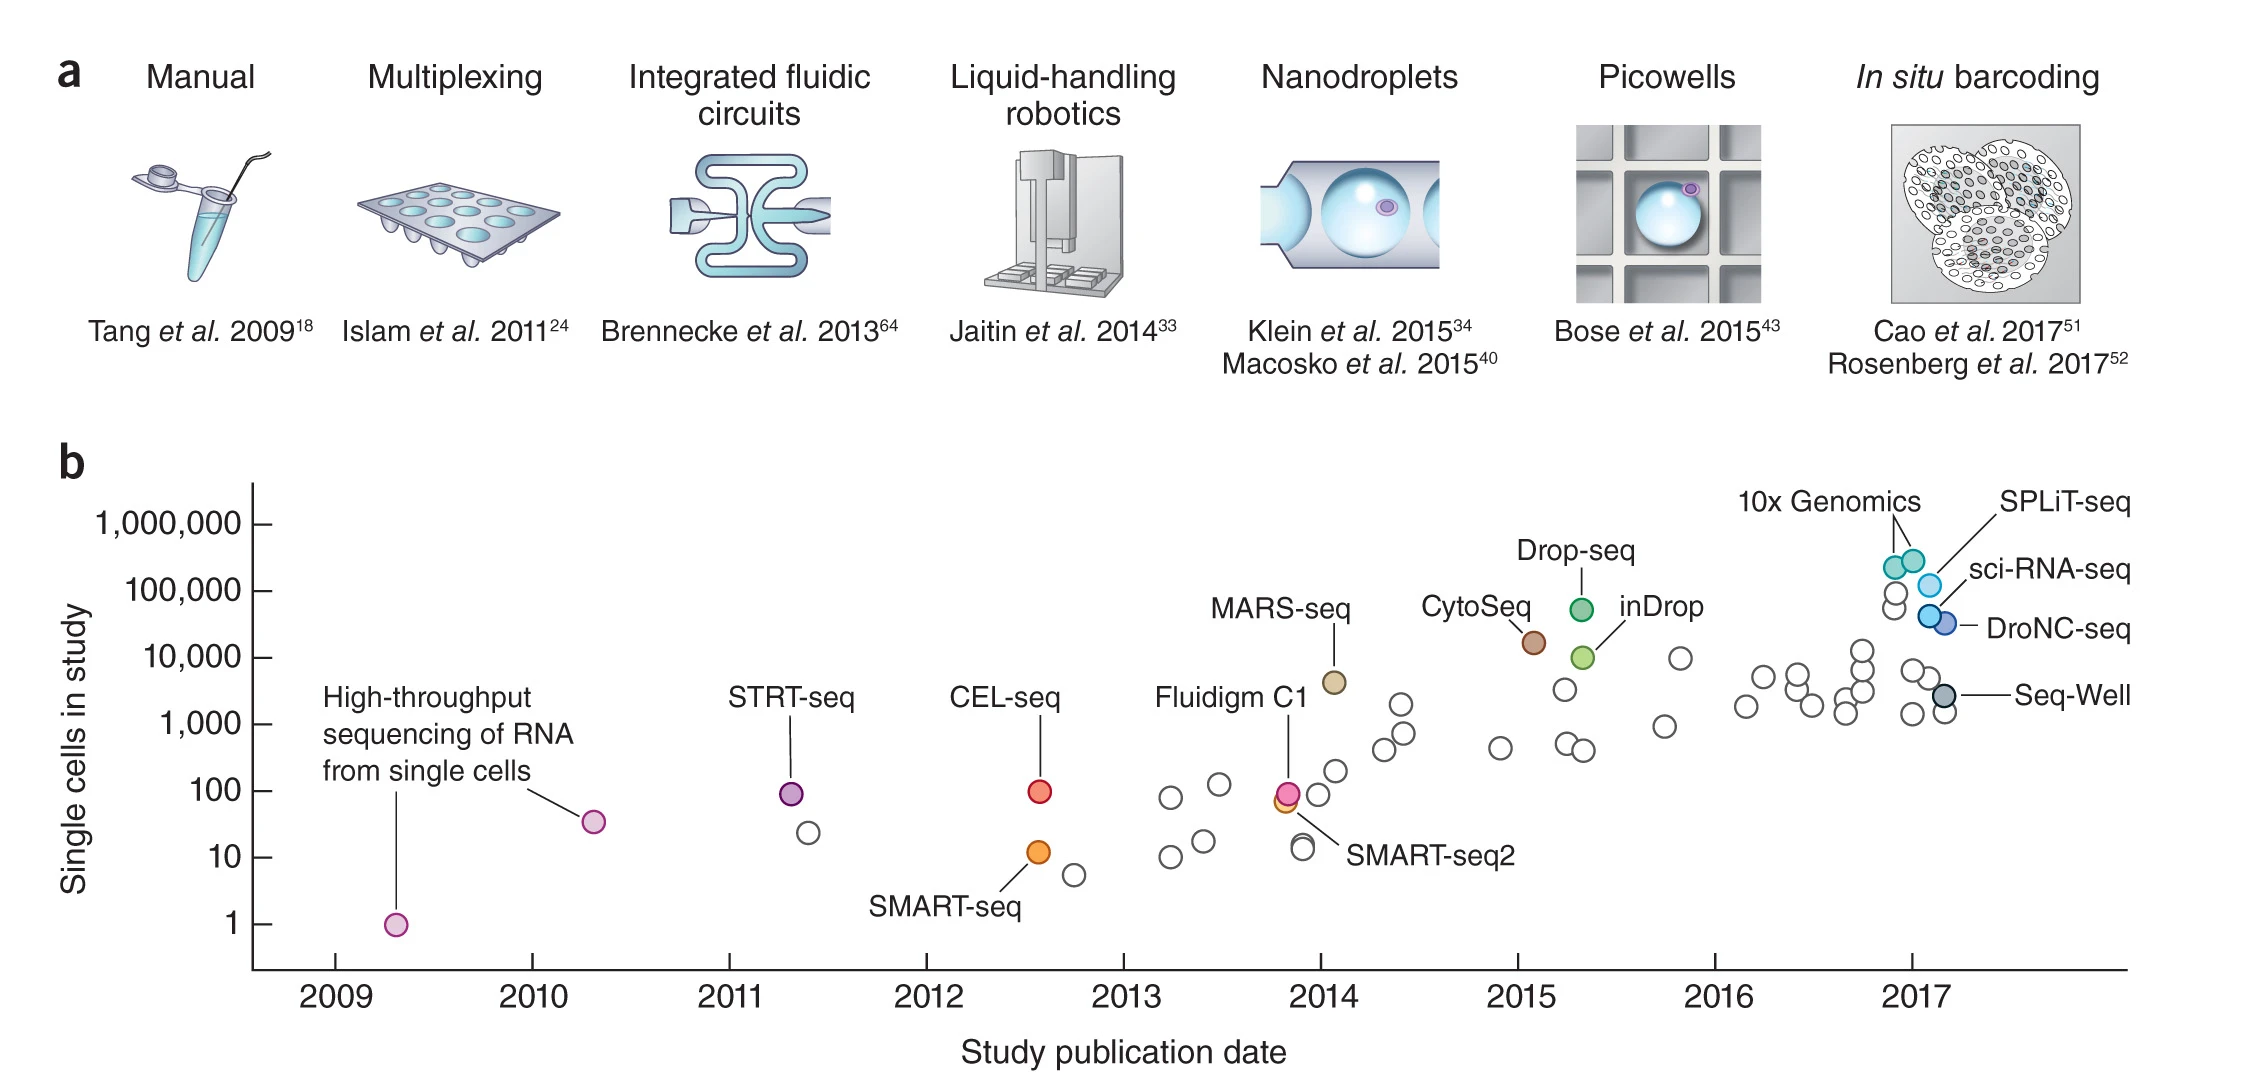
Furthermore, the tissue-resolution of bulk RNA-seq data prevents the precise description of the expression of a gene of interest and the detailed characterization of any transcriptomic modulations detected during analysis. To overcome these limitations, the 2010 decade has seen an explosion of protocols adapting RNA-seq to perform transcript sequencing at the single-cell level, notably through cell isolation techniques, nucleic sequence amplification and the use of cell barcodes. The combination of these techniques has enabled sequencing experiments to be automated, shortened and optimized. Current protocols allow individual profiling of tens of thousands of cells per experiment.

Single-cell RNA-seq based on droplet isolation
Among these protocols, the most frequently used are based on microfluidic manipulation techniques to automate cell isolation in emulsion droplets. The protocol begins with mechanical and enzymatic dissociation of the tissue of interest, enabling the cells to be suspended and then isolated from each other in droplets. Each droplet contains the reagents required for cell lysis, capture and retrotranscription of their polyadenylated RNA, as well as a gel bead on which are anchored dozens of oligonucleotides containing :
- a sequence enabling hybridization of the polyadenylated RNAs to initiate retrotranscription
- a molecular barcode or “UMI” to uniquely identify each molecule captured prior to amplification, and prevent quantification bias induced by uneven PCR amplification cycles
- a cell barcode unique to each droplet
- primers to amplify and read sequences
The addition of the cell barcode allows multiplexing of sequencing library preparation and amplification. Its subsequent reading enables each molecule to be assigned to a droplet and, by extension, to its cell of origin. Final quantification consists of counting the number of reads presenting a unique combination of cell barcode, UMI and associated gene.

Bioinformatics analysis of single-cell RNA-seq data
scRNA-seq enables the quantification of tens of thousands of genes in tens of thousands of cells. The aim of this exhaustive profiling is to distinguish stable or transient cell types or states that constitute physiological tissues, and to compare transcriptomic modulations induced by pathology, treatment or genetic modification.
To achieve these objectives, sequencing data are processed by bioinformatics analysis in 3 main phases.
- The primary analysis phase consists of converting the sequencing reads obtained into count matrices summarizing the expression of each gene in each cell.
- These count matrices then require special processing, due to their size and the mathematical characteristics of the data they contain. This secondary analysis is carried out by a sequence of statistical operations designed to eliminate sources of technical variation and identify the main sources of biological variation, in order to partition the cells according to the proximity of their gene expression profiles (clustering). When the study requires the analysis of several data sets, these treatments are applied to take into account disparities between sequenced samples via an integration process (batch correction).
- Once the cells have been grouped into homogeneous clusters, the final phase of the analysis consists in comparing them and biologically interpreting the statistical differences found, in particular by investigating the involved regulatory mechanisms.
Each of these three phases, as well as the integration of the data, involves the use of computational biology methods based on mathematical concepts, biological knowledge and computational resources. These methodological developments have produced a myriad of tools dedicated to the analysis of single-cell RNA-seq data. Despite the absence of a clear hierarchy for prioritizing the use of equivalent tools, a consensus has formed around the overall procedure and best practices to be adopted. To find out more about the concepts, methods and tools used, see the article dedicated to the guidelines for the analysis of single-cell RNA-seq data.
Strengths and limitations of the approach
Thanks to its resolution, single-cell RNA-seq can capture an overall view of the cellular heterogeneity of a tissue of interest, and explore the transcriptomic profiles of these different compartments individually. When comparing pathological/treated and control conditions, this resolution allows to characterize any modulations specifically induced in each cell population. This characterization involves identifying the signatures of genes differentially expressed in each population, and then using tools able to associate these signatures with functional mechanisms such as regulatory, signaling or differentiation pathways.
Despite the benefit of this new resolution, functional genomics at the single-cell level remains limited by the low capture efficiency of molecules of interest, due to the small amount of initial material and discontinuous regulatory dynamics such as transcriptional bursting. Moreover, the half-life of mRNAs reaches a median value of 9h in mammals. Detection of these molecules is therefore stochastic, implying partial quantification and noise due to the phenomenon of counts observed as zero (dropouts) in certain cells, while the gene is expressed by the rest of the population. Classically, around 90% of the elements of a count matrix are made up of null values. This particularity of single-cell RNA-seq data requires dedicated methods and procedures for the bioinformatic analysis, guaranteeing the biological interpretation of results. Finally, the transcriptome is only an intermediary level, reflecting genomic and epigenomic regulations and anticipating cellular function, which is largely defined by the proteome.
To overcome these limitations, new technical and methodological developments are needed, notably in RNA capture capabilities, integration of multi-omics data, spatial transcriptomics and long-read sequencing.
Bibliography
Svensson, V., Vento-Tormo, R. & Teichmann, S. A. Exponential scaling of single-cell RNA-seq in the past decade. Nat. Protoc. 13, 599–604 (2018)
Macosko, E. Z. et al. Highly Parallel Genome-wide Expression Profiling of Individual Cells Using Nanoliter Droplets. Cell 161, 1202–1214 (2015)
Zheng, G. X. Y. et al. Massively parallel digital transcriptional profiling of single cells. Nat.Commun. 8, 14049 (2017)
Rozenblatt-Rosen, O., Stubbington, M. J. T., Regev, A. & Teichmann, S. A. The Human Cell Atlas: from vision to reality. Nature 550, 451–453 (2017).
Schaum, N. et al. Single-cell transcriptomics of 20 mouse organs creates a Tabula Muris. Nature 562, 367–372 (2018).
